GlobalEdgeContinuity
|
Toolbar |
Menu |
|---|---|
|
|
Analyze Surface > Global Edge Continuity |
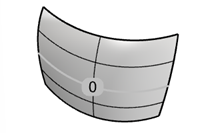
The GlobalEdgeContinuity command analyzes the continuity between multiple surfaces. It evaluates G0, G1, and G2 continuity along surface edge pairs and provides visual feedback that you can use as a guide to adjust the surfaces to achieve the desired continuity.
Steps
-
Select the surfaces or polysurfaces to evaluate continuity.
-
With a single surface selected, the directly connected surfaces are evaluated automatically. With multiple surfaces selected, only those surfaces are evaluated.
-
The evaluated surfaces can be joined or unjoined, but leaving them unjoined allows you to adjust the surface while the evaluation is active.
-
-
Select an edge number in the viewport or in the Results table to inspect deviations along the edge.
Options
 Add Objects
Selects more objects to analyze.
 Remove Objects
Removes selected objects from the analysis.
 Restore Defaults
Resets the settings to the defaults.
 Display Toggle
Turns the analysis display on or off while keeping the evaluated surfaces selected.
Display
Controls how the continuity analysis is shown in the viewport.
Labels
Displays edge numbers only.
-
Edges are numbered and the corresponding numbers can be found in the Results table.
-
Clicking an edge number in the viewport selects the corresponding edge in the Results table.
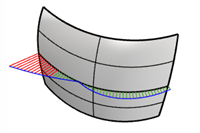
Graphs
Displays deviation graphs only.
-
The graph shows a visual representation of the deviation along the edge.
-
Edge segments out of tolerance display red hairs, while those within tolerance display green hairs.
-
Increasing Sample Count produces smoother graphs and displays more hairs.
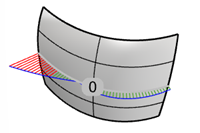
Both
Displays edge numbers and graphs at the same time.
Evaluate
Select whether to evaluate G0 (Position), G1 (Tangency), or G2 (Curvature) continuity between surfaces.
The recommended workflow
-
Start with G0 analysis.
Ensure all edge pairs meet the G0 tolerance and display in gray.
-
Proceed with G1 analysis.
Edge pairs within the G1 tolerance light up in blue. Those out of tolerance remain gray and appear in the Results table.
-
Continue with G2 analysis.
Edges within the G2 absolute tolerance are marked in white. G1 edges remain blue until they fall within the G2 tolerance.
Display Settings
Control how the analysis feedback appears in the viewport.
Graph Scale
Sets the height of the deviation graph hairs.
-
The graph shows only relative differences and does not indicate deviation direction. It is displayed on both sides of the surfaces so that it remains visible in the Shaded mode.
Sample Count
The amount of sample points evaluated per surface edge pair.
-
When an edge number is selected either in the Results table or in the viewport, deviation labels display along the edge. A deviation label is displayed for every ten sample points.
-
An additional green (passed) or red (failed) label marks the location of the maximum deviation.
Textdot Size
Controls the size of the labels for deviation values and edge numbers.
Wire Thickness
Sets the edge overlay width in pixels. The default is 3 pixels. The edge overlays shows if an edge meets G0, G1, or G2 condition.
Evaluation Settings
Define tolerances used to determine pass / fail conditions and filtering thresholds to discard edges.
Tolerance
The maximum deviation considered acceptable.
G0
Positional tolerance in model units. If an edge pair is within the G0 tolerance, it gets assigned a gray color to indicate it is join-able. The edges are considered positionally continuous.
-
The G0 deviation value displays at least three decimal places. To display more decimal places, change the Display precision setting in Options > Units.
G1
Tangency tolerance in angle degrees. This is the tolerance for edge pairs to be considered tangentially continuous. Once an edge pair meets the G1 tolerance, it is displayed in the G1 color.
-
If the surfaces will be offset, any angle between the surfaces will either lead to a gap or an intersection between the offset surfaces.
G2 abs
Absolute curvature tolerance. If an edge pair is within the G2 abs tolerance, it gets assigned a white color.
-
This value is inversely scale-dependent. Scaling the model up decreases the absolute difference, and scaling the model down increases it.
G2 rel
Relative Curvature tolerance. In some cases, this tolerance can be used for testing G2 continuity.
-
This value is scale-independent. Scaling the model does not change the relative difference.
-
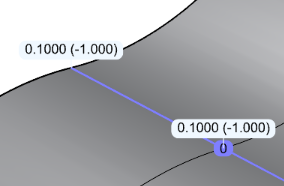
When the curvature directions invert along the edge (e.g., one surface curves up, and the other curves down), the relative curvature deviation displays -1.
Filter
Edges with deviation larger than these values are excluded from the evaluation.
-
In the example below, edge 2 can be excluded in the Result table because the angle between the two faces is 90°, which exceeds the default G1 filter of 20°. Enable Show Filtered G1 and G2 Edges to include this edge.
Pass / Fail Colors
The colors used to mark the edges that meet or exceed tolerance limits.
-
By default, edges within G0 tolerance display in gray, and edges out of tolerance display in red. Edges that pass G1 tolerance display in blue, and those that pass G2 tolerance display in white.
-
Click the color swatches to customize the colors.
Results
Show Good Edges
This toggle allows you to show or hide edges that are within tolerance.
Show Filtered G1 and G2 Edges
Includes the edges that are hidden by the G1 and G2 filters in the table.
Zoom for Selected Edge
Controls how closely the current viewport zooms in to the maximum deviation location on the selected edge.
Results table
Lists the evaluated edges with their maximum deviation values for each continuity type.
-
When an edge is selected in the table, the current viewport zooms to that edge.
-
Clicking an edge-number dot in the viewport selects the corresponding edge in the table.
Hold Shift to select additional edge-number dots, or hold Ctrl (Cmd on Mac) to deselect them.
-
Click a deviation column header to sort edges so the largest deviations appear at the top. Click the edge number column header to restore the default order.
See also
EdgeContinuity
Uses line hairs to visualize distance, tangency and curvature difference between an edge pair.