EdgeContinuity
| Toolbar | Menu |
|---|---|
|
|
Analyze Surface > Edge Continuity Panels Edge Continuity |
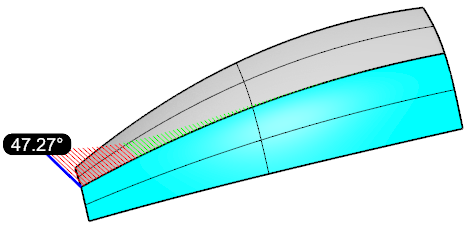
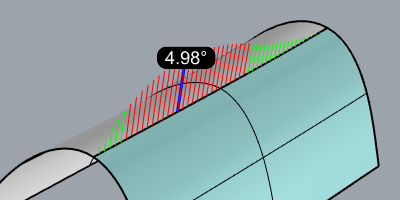
The EdgeContinuity command uses hair lines to visualize distance, tangency or curvature deviation between an edge pair.
Steps
-
Select two edges to evaluate.
-
Set options in the Edge Continuity panel.
Edge Continuity Options
Continuity
 Distance
Evaluates distance deviation between the selected edge pair.
The decimal places of distance deviation is controlled by Document Properties > Units > Display precision. (Decimal-only)
 Tangency
Evaluates tangent direction deviation between the selected edge pair.
Curvature
Evaluates curvature deviation between the selected edge pair.
This option displays absolute and relative (in parentheses) deviations.
-
Absolute curvature deviation = (1/Radius1)-(1/Radius2)
-
Relative curvature deviation = (Radius1-Radius2)/(Radius1+Radius2)
Density
Controls the density of the hair lines.
Distance/Tangency/Curvature Scale
The scale factor for the hair line length based on the selected continuity option.
Curvature tolerance
The allowed curvature difference.
Tangent tolerance
The allowed tangent direction difference.
Distance tolerance
The allowed gap distance.
- The tolerance values are the threshold between good and bad colors.
Good color 
A hair line displays this color if the evaluated value is below the tolerance.
Bad color 
A hair line displays this color if the evaluated value is above the tolerance.
Max color 
The hair line with the largest value displays this color.
Labels
 Show distance
Displays the largest distance deviation value in a dot.
Show tangency
Displays the largest tangent deviation angle in a dot.
Show curvature
Displays the largest curvature deviation in a dot.
Click to select one more edge pair.
Click to select one of the existing edge pairs to remove.
Click to remove all the evaluated edge pairs.
See also
CrvDeviation
Report the maximum and minimum distances between two curves.
CurvatureAnalysis
Evaluate surface curvature using false-color analysis.
Zebra
Visually evaluate surface smoothness and continuity using a stripe map.