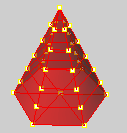
The ThicknessAnalysis command uses false-color display to evaluate the thickness of a solid.
Notes:
| ● | ThicknessAnalysis 指令的用途不是用來分析兩個不同的物件之間的距離。 To evaluate the distance between two surfaces compare the points on the first surface to the second surface using the PointDeviation command. |
| ● | The easiest way to generate a set of points on a surface is to create a mesh using the Mesh command and then use PointDeviation on the resulting mesh object and the second surface. |
步驟
| 4 | 輸入最小與最大可接受的厚度。 |
指令行選項
如果分析作業需要比較長的時間,會詢問是否繼續,例如:
您想要再繼續 6 分鐘的計算嗎?
是
再花 6 分鐘的時間進行分析作業。
No
停止分析作業。
無論多久都要繼續
分析作業持續進行直到完成為止。
範例
厚度分析對話框有一個數值範圍。
藍色 = B,紅色 = R。
假設 0 < R < B。
Rhino 會在每一個分析的網格頂點 V 的"另外一側"找到一個點 P。
d = P 與 V 之間的距離。
當 d <= R 時,網格頂點以紅色顯示。
當 d > B 時,網格頂點以白色顯示。
當 R <= d <= B 時,網格頂點以紅色與藍色之間的顏色顯示。
這個指令回報的百分比數字是以非白色顯示的網格頂點的比例。以這個例子而言:有某個比例的網格頂點到"另外一側"的點的距離是小於或等於 B。
網格頂點
頂點是網格面邊緣的匯集點,網格頂點包含 X、Y、Z 座標,也可能包含法線向量、色彩值及貼圖座標。

The ThicknessAnalysisOff command turns off thickness analysis display.
請參考