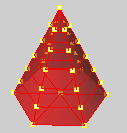
The ThicknessAnalysis command uses false-color display to evaluate the thickness of a solid.
Notes:
| ● | The ThicknessAnalysis command is not designed to evaluate the distance between two independent surfaces. To evaluate the distance between two surfaces compare the points on the first surface to the second surface using the PointDeviation command. |
| ● | The easiest way to generate a set of points on a surface is to create a mesh using the Mesh command and then use PointDeviation on the resulting mesh object and the second surface. |
Steps
Type the minimum or maximum acceptable thickness.
Command-line options
If the analysis takes a long time, a prompt to continue appears.
Do you want to continue for another 6 minutes
Yes
Continues the analysis for an additional six minutes.
No
Stops the analysis.
ForAsLongAsItTakes
Continues the analysis no matter how long it takes.
Example
The thickness analysis dialog box has a range of values.
Blue = B; Red = R
Assume 0 < R < B.
For each analysis mesh vertex V, Rhino searches for a point P on "the other side".
d = the distance from P to V.
If d <= R, the vertex V is red.
If d > B, the vertex is white.
If R <= d <= B, the vertex is the appropriate color in the range from red to blue.
The percentage reported is the percentage of analysis mesh vertices that are not white. In this example, it is the percentage of the analysis mesh vertices whose distance to the "other side" point is <= B.
Mesh vertex
The location where the edges of the mesh faces meet. The mesh vertex (plural vertices) contains x-, y-, and z-coordinates and may contain a vector normal, a color value, and texture coordinates.

The ThicknessAnalysisOff command turns off thickness analysis display.
See also
Rhinoceros 5 © 2010-2015 Robert McNeel & Associates. 17-Sep-2015